The Performance Platform exposes a lot of service data to interested parties, both within government and outside of it. We thought it would be interesting to tap into the platform, pluck out individual pieces of data and present them in a different way.
Here’s the creative brief:
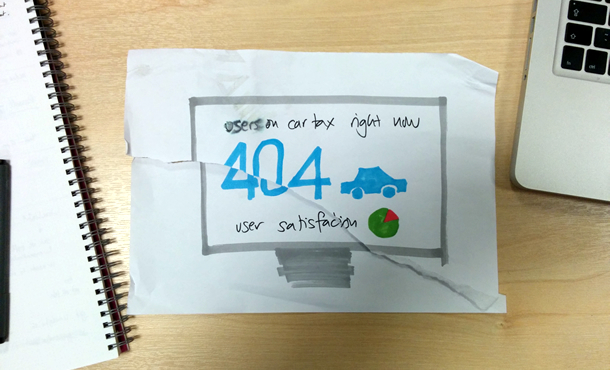
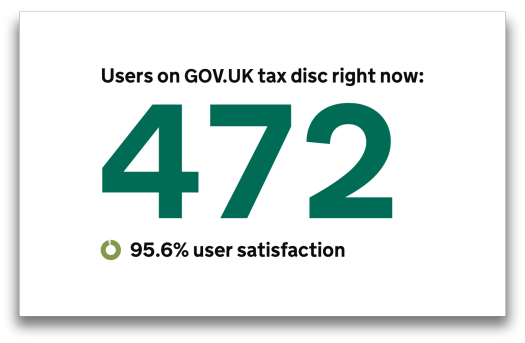
“Screens” like the one pictured above can be used at presentations and events on various devices and displays. The eventual aim is for them to find a home on those big TV screens you see in glossy ad agencies or pubs that show football. We needed:
- several independent screens, each showcasing a tasty morsel of data
- a cycling “container” to hold a selection of screens
- the ability for screens to function offline if necessary
What got built
This: https://gds-screens-items.herokuapp.com/
As someone who’s mostly comfortable hacking around with the html / css / js triumvirate I chose to use the “web platform” as opposed to anything else. Design and sketching was done in code for speed.
Google Chrome running in fullscreen mode displays the Heroku page when a connection is available. When offline is needed, a local install can be used instead.
Each “screen” consists of an html page, a script, and a css file. The cycling container consists of a set of iframes animated with css. Honestly.
Getting hold of the data
Service data is available from the Performance Platform API. For example, if I want to see how many people are currently on the start page for the Tax Disc transaction, I can query the API:
https://www.gov.uk/performance/tax-disc/api/realtime?sort_by=_timestamp%3Adescending&limit=1
In response I’ll get some json back to play with:
{
     "data": [
          {
               "_day_start_at": "2013-11-12T00:00:00",
               "_hour_start_at": "2013-11-12T11:00:00",
               "_id": "2013-11-12T11:02:04+00:00",
               "_month_start_at": "2013-11-01T00:00:00",
               "_timestamp": "2013-11-12T11:02:04+00:00",
               "_updated_at": "2013-11-12T11:02:04.232000",
               "_week_start_at": "2013-11-11T00:00:00",
               "for_url": "ga:pagePath=~^/tax-disc$",
               "unique_visitors": "362"
          }
     ]
}
As accessibility, bandwidth, and browser compatibility weren’t an issue for this project I chose the path of least resistance and simply used jQuery to fetch and insert what I needed.
A project like this one isn’t really appropriate to host on www.gov.uk itself, so cross domain requests to www.gov.uk/performance need to be handled.
A wee Sinatra app was made to deal with this. It acts as a proxy and simple server, displaying the html pages and grabbing data from the Performance Platform.
Offline considerations
Out and about doing presentations, there’s always a risk of being offline. A toggle variable was built in, that simply loads locally saved json files, rather than fetching them from the Performance Platform.
"The code is a bit bleurgh. Couldn’t you have…"
https://github.com/demotive/gds-performance-slides
The main objective here was to get all the things on the screens. There's plenty of scope for tweaks and improvements, as always things like:
- including a setup script to populate offline json files automatically
- implementing “offline” as a command line parameter rather than it being buried in javascript variables
- getting rid of those iframes - trying out different transition styles would be a lot easier without them
- doing a general code audit - tidy up all the scruffiness!
Where we ended up
The screens have managed to photo-bomb a few big GDS occasions so far, including....
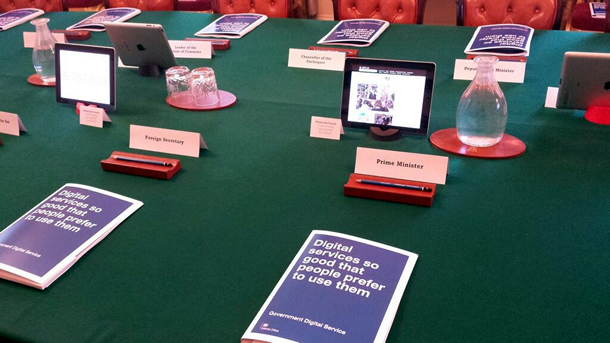
The Cabinet Office meeting, lurking on iPads.
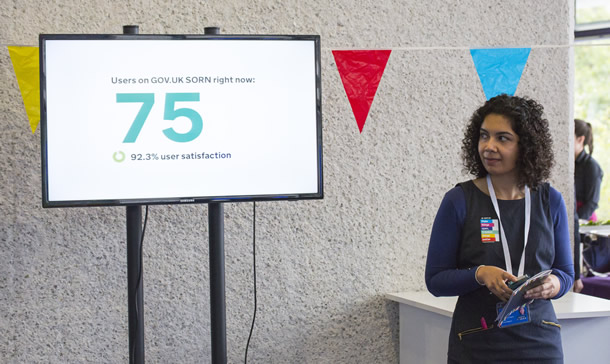
The Open Government Partnership summit.

And, most recently, during a visit from the Korean Minister of Science, ICT and Future Planning.
Take a look at the data yourself, or check out the project on GitHub.
Follow Mat on twitter: @demotive

3 comments
Comment by SEO Company posted on
Governmental performance highlights on the big screen, so much more purposeful than 'Match of The Day'.
Comment by Tiyo Kamtiyono posted on
Data is the fundamental factor of any project progress, thanks for sharing.
Comment by Rachel Reid posted on
Talk about timing!
A/R