Today, we’ve released an updated version of the Transactions Explorer, our tool for publishing performance data for the government’s transactional services.
Our list has expanded to include over 700 services, from 17 government departments. For 83 of the biggest services, we’ve published additional data on costs and digital take-up; we also have more data for some of the 'exemplar' services now being redesigned and rebuilt.
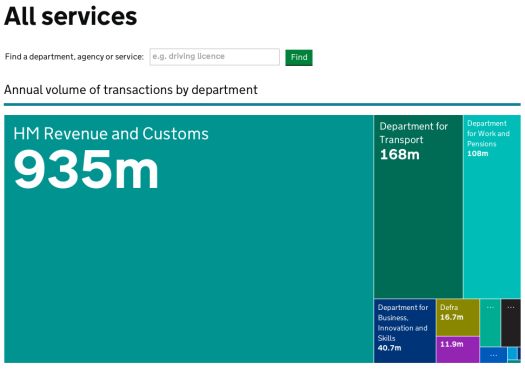
More data, more transactions
The Transactions Explorer includes data collected every quarter for a rolling 12-month period. This is our third dataset, covering April 2012 to March 2013.
For the first time, we’ve published data on services managed by the Department of Health and its agencies and public bodies. This includes two new high-volume services – European Health Insurance Card (EHIC) applications and Healthy Start reimbursements – and other services will be added with future releases.
For this release we’ve completely rebuilt the Transactions Explorer. We’ve integrated it with the Performance Platform, which will make it easier for us to support the tool and accommodate additional requirements. It’s been rewritten as a static site generated with Python, with some front-end functionality provided by JavaScript. As with most GDS products, the code is open-source and freely available on GitHub.
As ever, we’d love to know what you think of the Explorer – please let us know how we can improve it.

12 comments
Comment by Tim Briten posted on
When you click any of the links referring to the transaction explorer you are directed to this URL: https://www.gov.uk/performance/services
Which doesn't show you the view in screenshot. That view of annual transactions by department isn't apparent on the URL you are directing users to. Where can you find this view?
Comment by Louise Duffy posted on
Hi Tim,
The transactions explorer has been discontinued as a separate product. To replace it, we have this performance platform: https://www.gov.uk/performance/services and you can select individual departments from the drop-down menus at the top.
Hope that's useful.
Comment by EJA posted on
I was just wondering how digital take up is measured? For example, I recently applied for a passport using the new online service - but the forms took so long to arrive (over a week) that it was quicker to go to the Post Office, fill them in from scratch, and send them off. Was my application counted as digital or non-digital?
https://www.gov.uk/performance/transactions-explorer/service-details/home-office-passport-applications
Comment by cliffordsheppard posted on
Thanks for your interest, EJA.
Your passport application would have been counted as digital.
Digital take-up is defined as the proportion of transactions that are completed online.
Where a transaction can be completed online from end-to-end this is fairly straightforward to calculate. It starts to get more complicated with services like passport applications which require some offline processes, such as 'wet signatures' and the sending of photographs.
Transactions should be classified as digital 'only if a significant part of a transaction is completed online', and we feel that this is the case with passport applications.
(See https://www.gov.uk/service-manual/measurement/digital-takeup.html for more detail.)
If a service is only partially online it's not ideal for users and it significantly increases costs for departments. We encourage departments to design end-to-end digital services, and to eliminate offline processes wherever possible.
Comment by Roderick Spode posted on
I have looked at some of the figures in the new transaction explorer and I have a few questions:
Firstly, why are there are no figures for the percentage of digital take-up for state pension claims?
Secondly, the Jobseekers Allowance (new claims) figures show that digital take-up was up 25.05% from Q1 2013. However, if you look in the csv data file, the figures for Q1 were 3260000 for volume and 1011481 for digital volume. So, digital take-up at Q1 was 31%. If the value for digital take up is now 38.8%, surely the digital take-up figure only rose by 7.8%?
Lastly, I'm told that you can only apply for Jobseekers Allowance via the web site these days. If that's true and digital take-up really is 38.8% then what the deuce are the remaining 61.2% doing?
Roderick.
Comment by cliffordsheppard posted on
Thanks for your interest, Roderick.
We requested digital take-up data for high-volume services only – we've defined these as services with over 750,000 transactions per year. State Pension comes in just under this threshold, with about 570,000 new claims per year, which explains why we don't collect or publish digital take-up figures for this service.
The digital take-up increase is calculated as a percentage of the previous figure. A rise of 7.8 is just over a quarter of the previous figure of 31 – hence this represents an increase of 25% on the previous take-up level. We understand that showing percentage increases for figures that themselves are percentages may be confusing, and we're looking at how we can improve this.
The Jobseeker's Allowance page on GOV.UK suggests that you can apply by telephone if you're unable to do so online.
Comment by Roderick Spode posted on
Clifford,
Thanks for your speedy and informative response.
Point 1 - thanks and noted. The digital take-up figures can be calculated from the figures in the csv file anyway (10.56%).
Point 2 - I get the calculation now. As you say, perhaps a little confusing in presentation.
Point 3 - Thanks - of course, that implies 61.2% of those making new claims don't appear have access to the internet (or at least say they don't). An interesting statistic on its own.
Roderick
Comment by Robert Hansberryr posted on
This is a really good addition to GOV.UK. I like the simple layout and the 'transaction per year' information is a nice touch. The CSV download will be very helpful for our users.
I have just been looking through links for my organisation, the MHRA, and one of our links is broken. Can this please be fixed?
The broken link is on this page https://www.gov.uk/performance/transactions-explorer/search?keyword=mhra on the link for 'Yellowcard scheme reporting', the correct link should be: http://yellowcard.mhra.gov.uk/
Thanks
Rob
Comment by cliffordsheppard posted on
Thanks for your comments, Rob. The Yellowcard scheme link was fixed last week.
Comment by Tim Manning posted on
I thought this was a good piece of work at the time (2009). Still relevant ?
https://www.gov.uk/government/uploads/system/uploads/attachment_data/file/60975/designing-URI-sets-uk-public-sector.pdf
Comment by Mike Thacker posted on
The visualisation of high volume transactions is clear and I welcome the CSV download so the data can be re-used.
What I'd really like to see is a consistent ontology (or data model) that links the departments, bodies/agencies, services in your data to one another and to other data GOV.UK holds, such as policies. We need an identifier for each element (ideally a persistent URI that dereferences to a page defining the element) that is used consistently across GOV.UK and encouraged in all linked data from elsewhere.
Local government does this for services ( http://id.esd.org.uk/list/services ) and interaction types ( http://id.esd.org.uk/list/interactions ), which you call service types in the CSV. You use these to index links to council websites. DCLG provides URIs for councils (see http://opendatacommunities.org/data/local-authorities ). So we need the same concepts in central government if we are to move to having a joined up data model for understanding government.
Comment by Paul Davidson posted on
Yes - a simple ontology that nails down ideas like Service, Location, Organisation, Metric, Resource, and the connective reference data for each ( sources of identifiers, and categorisations ). We ( the local eGovernment Standard Body ) are working on this with BIS within the Smart Cities program, and the classifications from the esdToolkit. Keen to explore how this can fit with caseload type data.