Back in June, I wrote about the content dashboard which I built to help editors improve content on GOV.UK. In this update, I’d like to give an example of how it has been used by the GDS team to detect a problem and ultimately help develop and validate the bug fix.
Smart Answers
The content on GOV.UK is divided into several different formats which allow us to communicate important information in the most appropriate way.
For complicated or transactional style questions that require specific input we have the Smart Answer category which guides the user through a series of questions that result in one of several possible answers. In this case, we describe an engaged user as someone who reaches any one of these outcomes as this means that they must have successfully interacted with the format (and not dropped out mid-flow).
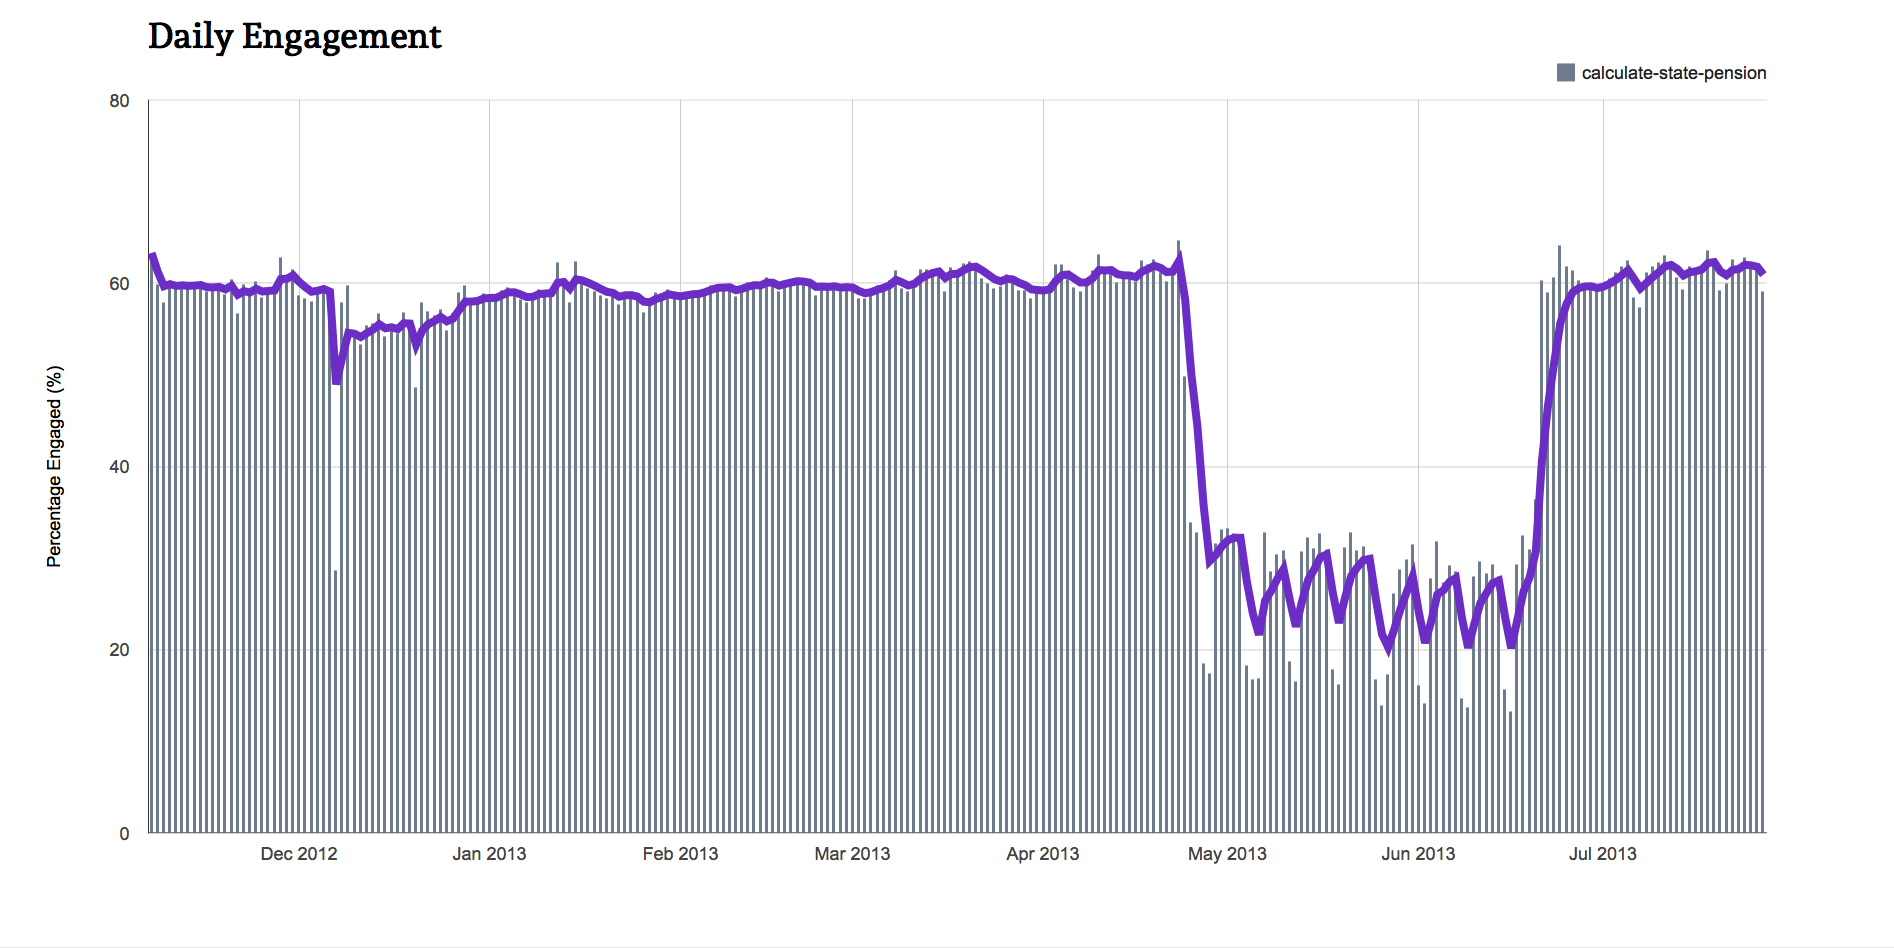
Towards the end of April I noticed a drop in engagement across all of our 40+ Smart Answers which resulted in an alert on the Dashboard frontend. I’ve included a snapshot of the State Pension Calculator data for the period in question which was representative of the across-format drop.
What the data revealed
Looking at the time series data, two things are immediately obvious:
- The drop was sudden and occurred over the course of two days
- The engagement went from a reasonably stable value to one which displays strong weekday/weekend dependence.
In order to investigate the first point, I looked at the page update history which shows a roll-out on the 24th April for all Smart Answers. This gave our developers the starting point they needed to check whether any code issues were present in that particular release.
The reason behind the second point is a little more subtle. In general, the engagement should be independent of visitor numbers, providing you have a large enough sample to rule out unrepresentative data (e.g. 5-10 visits per day could easily result in a large spread of values). The pattern seen after the drop correlated directly with the number of visits to the page, implying that for a proportion of users their visits were logged but not their successful navigation to an answer. This assumption is confirmed by the fact that the visit data for the pages had not changed during this period.

It is important to point out that there was no indication we had any problems with the pages themselves, merely our ability to track whether users had completed their journey. The content had not changed between iterations, and there was no increase in feedback volume which would have indicated a more substantial technical or editorial issue.
Bug bashing
The developers here in GDS confirmed that this was the case as the update on the 24th contained a section of code that interfered with analytics tracking in certain browsers. Ultimately, this meant that we were collecting a combination of true engagement values with false negatives that stemmed from the inability to log when an answer was reached.
The fluctuation of traffic over the course of a week was harder to pinpoint, but we got there in the end; Internet Explorer wasn’t affected by the bug. That browser accounts for the majority of visits to smart answers during the week, but the margin shrinks somewhat during the weekend. This is why we started to see a pronounced weekly fluctuation in engagement where there wasn’t one before.
As can be seen in the graph, the bug was fixed on the 20th June which was confirmed by the recovery of both the engagement values and their behaviour over time. We prioritise bugs which affect users’ experience, which is why there was such a delay between discovering the problem and fixing it.
This case is one of several examples of how the dashboard has proved useful internally to help us monitor the performance of our content. Despite this bug not having any direct impact on users, it was important that we found the cause as without reliable and accurate data it is much harder for us to know with any certainty what constitutes abnormal behaviour.
This example also highlights the importance of daily updates in giving us the fine-grain detail necessary to develop informed hypotheses. A weekly aggregated value would have delayed investigation in this instance and averaged out the subtle day-by-day variations which helped us isolate potential sources of the bug.

6 comments
Comment by jim posted on
Excellent. Good detailed example of how the dashboard can be used to identify anomalies. Look forward to the next update.
Re your second graph, is the page update history directly correlative with the site visit data?
Comment by Daniel Collins posted on
Hi Jim,
The page update graph is not meant to support the comment about page visits however I see how this might follow due to its positioning. More generally speaking (and in case I misunderstood your question), we don't tend to see any correlation with updates and visits as we do not publicise all of the incremental releases.
Thanks
Dan
Comment by Jim posted on
Great - thanks for your response.
Comment by baragouiner posted on
Hi Daniel,
Interesting post. Can you explain why 7 seconds has been chosen as the cut-off time when measuring engagement with content? Is there evidence from elsewhere to justify it?
Thanks.
Comment by Daniel Collins posted on
Hi Graham,
This value was set a while back and was based on some small scale user testing. It is in no way meant to be an authoritative definition of engagement, more a constant value against which similar material can be compared.
Engagement is notoriously hard to pin down and in many ways it should comprise of a combination of measures which, when taken together, give a clearer picture. With our content we also include link clicking as an indicator of interaction with the page.
The important thing is that such criteria are defined and fixed for a period to allow comparisons over time.
Thanks
Dan
Comment by The Smart Answer Bug – Government Digital Service | Public Sector Blogs posted on
[…] Original source – Government Digital Service […]