GDS has published the Digital Landscape Research today alongside the Government Digital Strategy. We want to tell you more about the research, and why we did it.
Finding out more about our users
Our design principles put users at the heart of our work at GDS. So when we started work on the Government Digital Strategy, we went straight to user research.
We started by reviewing existing research to see what insight had been gathered on the digital landscape by ourselves and others. This gave us an excellent understanding of people who are online and offline. But we realised there were gaps in our knowledge.
We needed to understand even more about how people use (or don’t use) government digital services and information. To inform our work on assisted digital, we wanted to look in more detail at people who are offline.
To fill these gaps, GDS’s Usability and Insight team commissioned 2CV to conduct independent research to provide a comprehensive view of UK adults' use of the internet and in particular, the use of online government information and services.
What did it involve?
The research was conducted in two parts. The first part was quantitative and the second part was qualitative.
We used a mixed methodology approach for the quantitative stage, using both online interviews and face to face interviews. We chose to do this instead of all face to face interviews because the objective of the research was to understand what people do online and their attitudes towards it, and not to identify how many people are online or offline. The Office for National Statistics (ONS) produces robust quarterly data on the online/offline audience and it seemed unnecessary to replicate this. ONS’s latest internet population data (Q1 2012) was then used to weight our data so that it accurately reflected the number of people who are online in the UK.
The approach for the qualitative stage involved ethnography sessions, peer interviews, and intercept interviews in relevant locations (like libraries, UK Online Centre, and a Skills for Life Centre) to observe people as they used the internet. This approach was used to give a rich understanding of people’s attitudes towards the internet and digital government services, and it also enabled us to witness the issues and problems people face when using government information and services. The findings from these sessions then informed 2CV's groupings or typologies of non-users of government online information and services.
Online and offline audiences
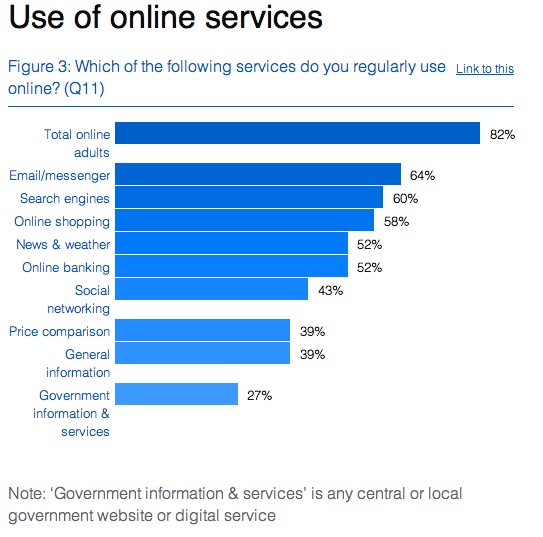
As indicated in the previous section on weighting, the ONS’s latest internet usage statistics found that 84% of UK adults have used the internet (including 2% who rarely use the internet), and 16% have never used the internet.
As we believe the barriers to going online are largely the same for those who have never accessed the internet as those who access it rarely, we decided to combine these two groups in our definition of the offline audience, concluding that 82% are online, and 18% are offline. This also meant our estimate of those online was conservative, and we didn’t assume more people used the internet than actually did. Furthermore, as indicated in the groupings, not all of the people who are online will be confident internet users.
It’s important to also remember each government service is likely to have a slightly different audience depending on the service it offers. This research gives an overview of the whole population and will be used alongside user data for individual services.
So what has it told us?
Important findings from the research include:
- approximately half (54%) of UK adults have used online government services or information in the last 12 months
- a further 28% of UK adults are online but choose to find government information, and/or complete government transactions, through other channels
- drivers for using online government services included saving time, having sites that are clear and easy to use, enabling services to be done out of office hours, and it being less hassle than dealing with someone over the phone
You can read the main findings from the research now, and also download the full data tables. You can also see how it is being used to inform the Government Digital Strategy.


11 comments
Comment by Liz posted on
Hi Nick, can I clarify whether the researchers distinguished between central and local government info and services when they asked participants about whether they had used a government transaction or accessed government information online?
Thanks v much
Liz
Comment by Nick Breeze posted on
Hi Liz,
For services respondents were presented with a list of the Top 30 transactions and these ranged from ones with high traffic (Car Tax) to low traffic (fishing licence). For the information question respondents we didn't specify on whether it was local or central government.
Thanks,
Nick
Comment by Mark Frank posted on
**To Potential Users of the Digital Landscape Survey Data**
Tim Davies and I (University of Southampton) are planning a small piece of research around the structure and format of this data and would be interested to contact anyone who has used it, plans to use it or would like to use it but has a problem.
If you interested in participating please contact me (Mark Frank) on mtf1c08@soton.ac.uk before 14th December 2012.
Comment by baragouiner posted on
Thanks Nick.
Comment by baragouiner posted on
Hi Nick,
I’m trying to understand a couple of things:
* whether the data can be rendered for Wales (accepting the issue of small sample size)
* whether respondents are given any examples of services when asked if they have ‘accessed central government information or transactional services online in the past year’
* what ‘regularly’ means in ‘regularly use Government information and services’
If I could glean this from the questionnaire, please could you email it to me? Or could you publish it on the Research page as Annex 2?
I’ve downloaded the data but must admit that I can’t get my head around it!
Comment by Nick Breeze posted on
Hi,
The term 'regularly' was self defined, so no time period was given - we expected each user to have something that they could relate to doing regularly e.g. social media, email etc and compare the frequency of other tasks to these. However, when asking about Government Transactions in detail, each respondent was presented with a list of the Top 30 transactions - from Car Tax to Fishing Licence etc, and asked to indicate which ones they had completed in the last 12 months. I'll get the questionnaire uploaded this afternoon and you can see the list of transactions yourself. In regard to rendering the findings to Wales, it was 5% of the sample (65 respondents), so it will give you an indication on an overall level, but you'd need a larger sample size to get a more accurate/detailed picture.
Thanks,
Nick
Comment by Tim Davies posted on
Hey Nick. Great to see this research shared along with it’s data. However, in trying to explore the data to understand where the types of groups in it come from, and to explore other underlying data I hit a few challenges from the data the data was structured, and the lack of a codebook etc.
I’ve jotted down some reflections in this blog post http://www.opendataimpacts.net/2012/11/more-than-csv/ in case useful.
Comment by Tim Davies posted on
Hey Nick. Great to see this research shared along with it's data. However, in trying to explore the data to understand where the types of groups in it come from, and to explore other underlying data I hit a few challenges from the data the data was structured, and the lack of a codebook etc.
I've jotted down some reflections in this blog post http://www.opendataimpacts.net/2012/11/more-than-csv/ in case useful.
Comment by Nick Breeze posted on
Hi Tim,
Thanks for your email and the link to your blog. Sorry that the data wasn't as helpful as I intended. I have you're email address so I can send you the questionnaire we used - hopefully this should help. I’m happy to discuss the research in more detail if you like - including how the groups were formed. I'll include my contact details in my email.
Thanks,
Nick
Comment by Tim Davies posted on
Thanks Nick. E-mail received.
Comment by Chris posted on
Interested to see that you've got the research and strategy as both HTML and PDF. Do you have any research that backs up whether users want lengthy 'publications' as HTML pages?